5 Metrics To Track Shoppable Video Performance
Learn the essential metrics for measuring the success of your shoppable videos and how to optimize them for better sales performance.
5 Metrics To Track Shoppable Video Performance
Shoppable videos make it easier for customers to buy products directly while watching engaging content. To measure their success, focus on these 5 key metrics:
Engagement Rate: Tracks likes, shares, and comments. Formula:
(Total engagements ÷ Total video views) × 100.Click-Through Rate (CTR): Measures clicks on product links. Formula:
(Number of clicks ÷ Total video views) × 100.Conversion Rate: Shows how many viewers become buyers. Formula:
(Purchases from video viewers ÷ Total video views) × 100.Average Order Value (AOV): Calculates average spending per order. Formula:
Total revenue from video ÷ Video-generated orders.View Duration: Measures how long viewers watch. Key metrics include average watch time, completion rate, and drop-off points.
Quick Overview of Best Practices:
Video Length: 21–34 seconds performs best.
Format: Vertical videos (9:16) get 40% more attention.
Content Types: Product demos, user reviews, and founder stories drive higher engagement and sales.
Placement: Add videos where users naturally pause, like below the fold on homepages.
Track these metrics regularly and refine your strategy using tools like ReelTok or Shopify analytics.
How To Setup Shoppable Videos For Shopify
1. Engagement Rate
Engagement rate tracks how actively viewers interact with your shoppable videos through likes, shares, and comments. It's a solid indicator of whether your content connects with your audience and encourages meaningful actions. To calculate it, use this formula: (Total engagements ÷ Total video views) × 100. This metric gives you a window into how audience interaction ties to potential buying behavior.
If you want to improve engagement, here are some strategies to try:
Keep it short and sweet: Videos between 21–34 seconds hold attention better [1].
Think mobile-first: Vertical videos (9:16 aspect ratio) grab up to 40% more attention than square or horizontal formats [1].
Be relatable: Content like user-generated clips, founder stories, and product demos tends to perform well [1].
Here’s an example of how engaging videos can make a difference:
"Finally, an app that combines creativity with commerce! ReelTok's video ads are engaging, and the AI-driven targeting ensures my ads reach the right audience." – BabyBoutique
A strong engagement rate doesn’t just mean people are watching - it means they’re actively interacting with your content.
2. Click-Through Rate (CTR)
CTR measures how well your shoppable videos drive clicks on product links, turning viewers into potential buyers. It's calculated as: (Number of clicks ÷ Total video views) × 100.
A strong CTR shows your videos are not just grabbing attention but also sparking genuine interest in your products. To improve your CTR, try these strategies:
Product placement that makes sense: Tag products when they’re in the spotlight, not just at the beginning.
Clear calls-to-action: Use on-screen text to encourage clicks on featured products.
Mobile-friendly formats: Use vertical (9:16) videos, which grab 40% more attention [1].
These tweaks can make your shoppable videos feel more integrated into the shopping experience.
Video Types That Drive Higher CTR
Video Type | Why It Works |
|---|---|
Product Demos | Shows how the product works and its perks. |
User Reviews | Builds trust with real-life experiences. |
Founder Stories | Adds a personal touch to your brand. |
Unboxing Videos | Highlights details and creates buzz. |
For best results, place these videos just below the fold on your homepage, where they’re most likely to catch a shopper’s eye. Keep them short and to the point for maximum engagement.
Next, we’ll dive into how improving CTR ties directly to boosting your store’s conversion rates.
3. Conversion Rate
The conversion rate measures how well your shoppable videos turn viewers into buyers. It’s calculated using this formula:
(Number of purchases from video viewers ÷ Total video views) × 100.
With 87% of customers influenced by video and 81% of marketers reporting increased sales from video content [1], this metric highlights how much revenue your videos can generate.
Key Factors That Impact Conversion Rate
Factor | Effect on Conversions | How to Improve It |
|---|---|---|
Video Length | Shorter videos hold attention better | Focus on key product benefits |
Placement | Strategic placement boosts visibility | Place videos where users naturally pause |
Content Type | Builds trust through relatable content | Use real customer experiences |
Video Format | Mobile-friendly design is essential | Optimize for mobile and other platforms |
These elements play a direct role in influencing viewer decisions, making them critical for better conversions.
To boost your conversion rate, create videos that highlight product features, include customer testimonials, and incorporate user-generated content. For example:
Show how your product solves specific problems.
Feature real customers sharing their results.
Include user-created content to establish trust.
Tracking and Improving Performance
A solid conversion rate means your videos are addressing customer needs and driving sales. In fact, 64% of consumers are more likely to buy after watching a product video [1].
Continuously monitor your conversion rate and adjust factors like video length, placement, and content style to keep up with changing trends and audience preferences. Tools like ReelTok make it easy to track and fine-tune these metrics in real-time.
4. Average Order Value (AOV)
Average Order Value (AOV) measures how much customers spend through shoppable videos. It’s a key indicator of how well your video strategy encourages larger purchases.
Calculating Video-Driven AOV
Here’s the formula to calculate AOV for video-driven sales:
Total Revenue from Video Purchases ÷ Video-Generated Orders = Video AOV
For example, if your videos generate $50,000 in sales from 500 orders, your AOV would be $100.
Strategies to Boost AOV
Want to increase your AOV through shoppable videos? Here are a few popular approaches:
Strategy Element | AOV Effect | How to Apply It |
|---|---|---|
Product Bundling | Encourages larger carts | Feature related items together in your videos |
Cross-Selling | Adds related purchases | Tag multiple complementary products |
Premium Features | Supports higher pricing | Highlight standout features or benefits |
Seasonal Promotions | Boosts purchase size | Create themed video collections |
Using AOV Data to Improve Sales
Focus on showcasing high-value products or bundled deals in your videos to drive up sales. Here are some ideas:
Highlight premium products with in-depth demonstrations
Group complementary items into bundles
Emphasize long-term savings or additional value
Real-Time Analytics
Real-time analytics can help you fine-tune your video strategy. Use tools to track your video AOV and uncover trends like which video styles drive bigger purchases, which product combinations perform best, and where to place your videos for maximum impact. With 81% of marketers reporting increased sales from video [1], keeping an eye on AOV is essential. Platforms like ReelTok offer dashboards that make it easy to monitor these metrics and adjust your approach.
5. View Duration
View duration measures how long customers watch your shoppable videos, offering insights into engagement and sales potential. With 87% of customers stating that video helped them make a buying decision [1], increasing watch time can directly influence conversions.
Understanding View Duration Metrics
Several key metrics help break down view duration:
Metric | What It Measures | Why It Matters |
|---|---|---|
Average Watch Time | Total viewing time divided by the number of plays | Shows overall engagement with your content |
Completion Rate | Percentage of viewers who watch the entire video | Indicates how effective your content is |
Drop-off Points | Moments when viewers stop watching | Identifies where content might lose interest |
Rewatch Rate | How often viewers replay parts of the video | Highlights particularly engaging sections |
These metrics help you refine your content and determine the ideal video length.
Optimal Video Length
For better viewer retention, aim to keep your videos between 21 and 34 seconds [1].
Placement’s Role in View Duration
Where you place your videos matters. Positioning shoppable videos just below the fold on your homepage increases visibility and encourages users to naturally discover the content while browsing [1].
Tips to Improve View Duration
Boosting watch times and engagement is achievable with a few strategies:
Focus on clear, engaging content that highlights your product's value.
Use vertical videos, which can lead to 40% more views [1].
Incorporate user-generated content and product demos to build trust.
Leverage real-time analytics to identify what works best.
Tracking and Optimizing Performance
Analytics tools provide detailed data to help you refine your video strategy. By tracking view duration, you can identify which products capture attention, the most effective video styles, and the ideal lengths for different product categories. Placement insights also play a role in improving performance. With 64% of purchasers more likely to buy after watching a product video [1], optimizing view duration can significantly boost sales. Use tools like ReelTok to monitor these metrics and fine-tune your approach.
Next Steps
Boost your shoppable video performance with these actionable strategies:
Creating a Data-Driven Strategy
Metric | Action Steps | Expected Impact |
|---|---|---|
Engagement Rate | Track likes, shares, and comments to find top styles | Helps craft more engaging future videos |
Click-Through Rate | Experiment with CTAs and product placement timing | Increases product discovery and clicks |
Conversion Rate | Identify video types that drive the most sales | Refines content creation priorities |
Average Order Value | Compare multi-product vs. single-product videos | Fine-tunes product grouping strategies |
View Duration | Determine ideal video length and drop-off points | Improves viewer retention |
Implementation Tips
Put your data insights into action with these steps:
Define benchmarks and set measurable goals.
Test one variable at a time to pinpoint what works.
Review performance on a weekly basis to stay on track.
Leveraging Analytics Tools
Real-time analytics are key to making informed decisions. Use them to monitor:
Video performance in different placements.
Peak times for viewer engagement.
Effects of various video styles.
How well product tagging performs.
These insights will help you refine your approach for better results.
Optimization Process
Use your performance data to continually improve by:
Analyzing metrics across all videos.
Making adjustments based on data insights.
Testing new ideas to see what resonates.
Focus on creating short, engaging videos that showcase your products effectively. Measure results across placements, track engagement trends, and fine-tune product tagging to maximize your success [1].
Related articles
More from Shoppable Video
How to Use Shoppable Videos for Brand Storytelling
Learn how shoppable videos can enhance brand storytelling, boost sales, and engage customers in a dynamic shopping experience.
Shoppable Videos vs Static Images: Conversion Rate Study
Shoppable videos significantly boost e-commerce conversion rates, outperforming static images in engagement and sales potential.
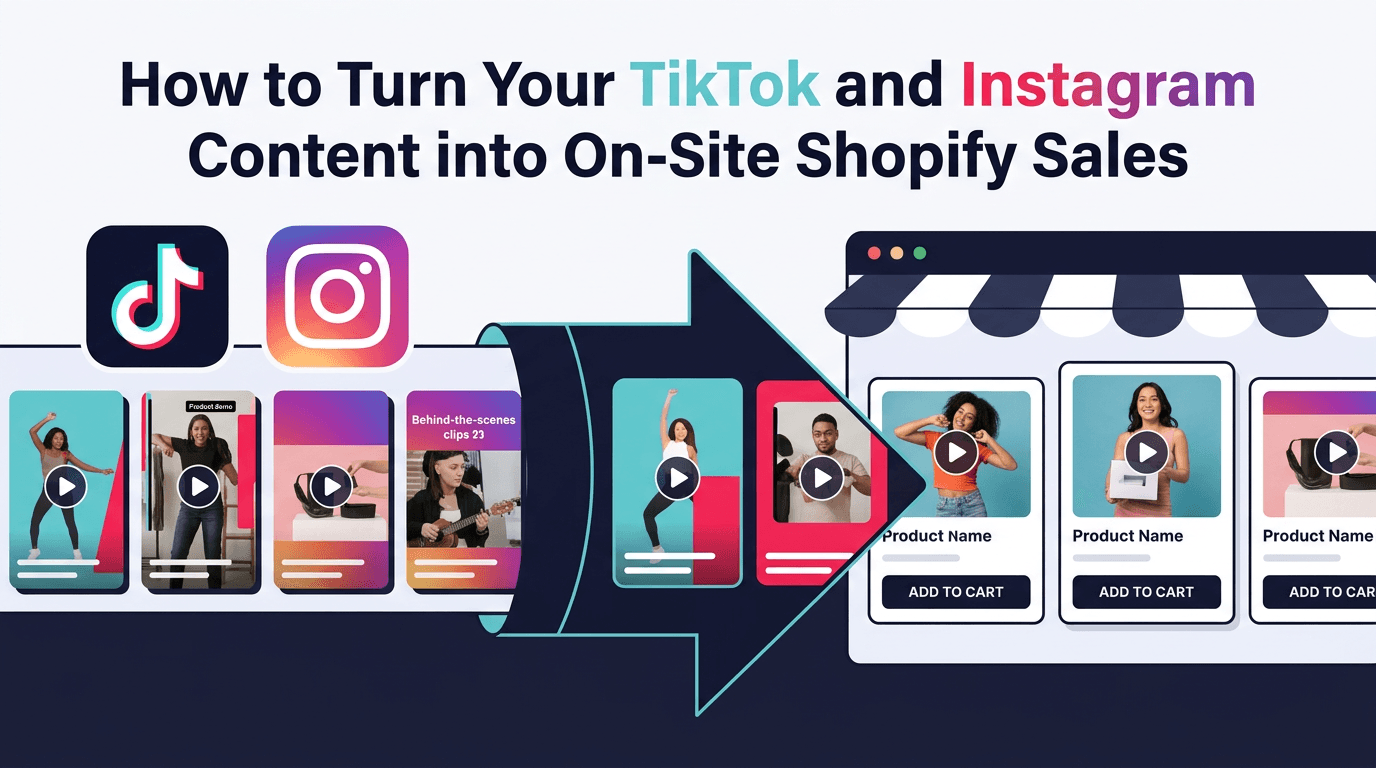
How to Turn Your TikTok and Instagram Content into On-Site Shopify Sales
Stop letting your best social content die in the feed. Repurpose TikTok and Instagram videos into shoppable on-site experiences.